
HR glossary
Employee turnover rate
Employee turnover rate is the percentage of employees who leave an organization during a set period, usually a month, quarter or year.
Turnover rate is the share of your workforce that left during a period. It counts everyone who left: resignations, terminations, retirements and people whose contracts ended.
Most teams split it into voluntary turnover (people chose to go) and involuntary turnover (the company ended it). The voluntary number is the one to watch. It tells you who is walking out the door and, if you look at it by team or manager, where.
Healthy turnover varies a lot by industry. Retail and hospitality run far higher than software or government. Compare yourself to your own history and to companies that hire for the same roles.
How to calculate employee turnover rate
Turnover rate = (separations ÷ average headcount) × 100
- Separations: everyone who left during the period
- Average headcount: (headcount at start + headcount at end) ÷ 2
Example: 12 people left this quarter. You started with 190 people and ended with 210, so average headcount is 200. 12 ÷ 200 × 100 = 6% quarterly turnover.
What the research says
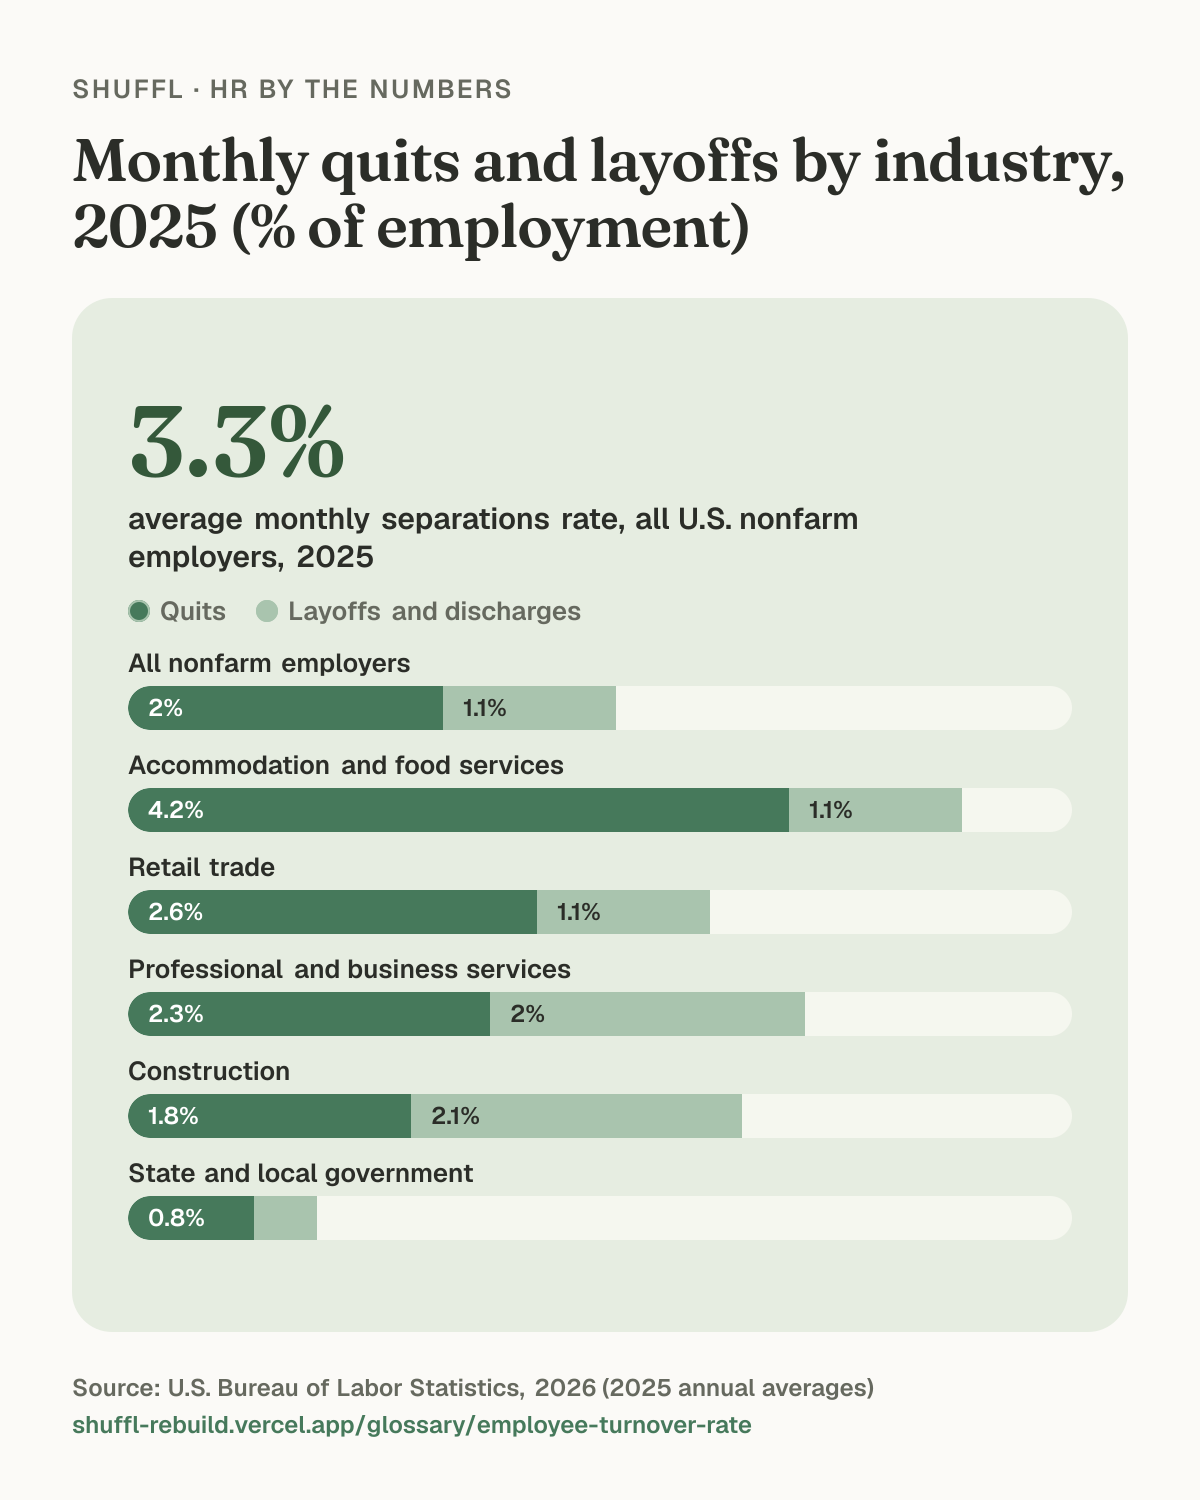
The U.S. Bureau of Labor Statistics tracks separations through its Job Openings and Labor Turnover Survey (JOLTS), which samples about 21,000 employers.1 Across all nonfarm employers in 2025, an average of 3.3% of workers left their jobs each month.2 Quits were the largest part, at 2.0% a month, with layoffs and discharges at 1.1%.2
Those are monthly rates. Twelve months at 3.3% adds up to roughly 40% a year for the economy as a whole, a figure pulled up by high-churn industries. The spread is wide: accommodation and food services averaged 4.2% quits a month in 2025, while state and local government averaged 0.8%.2
Shuffl · HR by the numbers
Monthly quits and layoffs by industry, 2025 (% of employment)
Monthly quits and layoffs by industry, 2025 (% of employment). 3.3% average monthly separations rate, all U.S. nonfarm employers, 2025. All nonfarm employers: 2% Quits, 1.1% Layoffs and discharges. Accommodation and food services: 4.2% Quits, 1.1% Layoffs and discharges. Retail trade: 2.6% Quits, 1.1% Layoffs and discharges. Professional and business services: 2.3% Quits, 2% Layoffs and discharges. Construction: 1.8% Quits, 2.1% Layoffs and discharges. State and local government: 0.8% Quits, 0.4% Layoffs and discharges. Source: U.S. Bureau of Labor Statistics, 2026 (2025 annual averages).
Why people leave
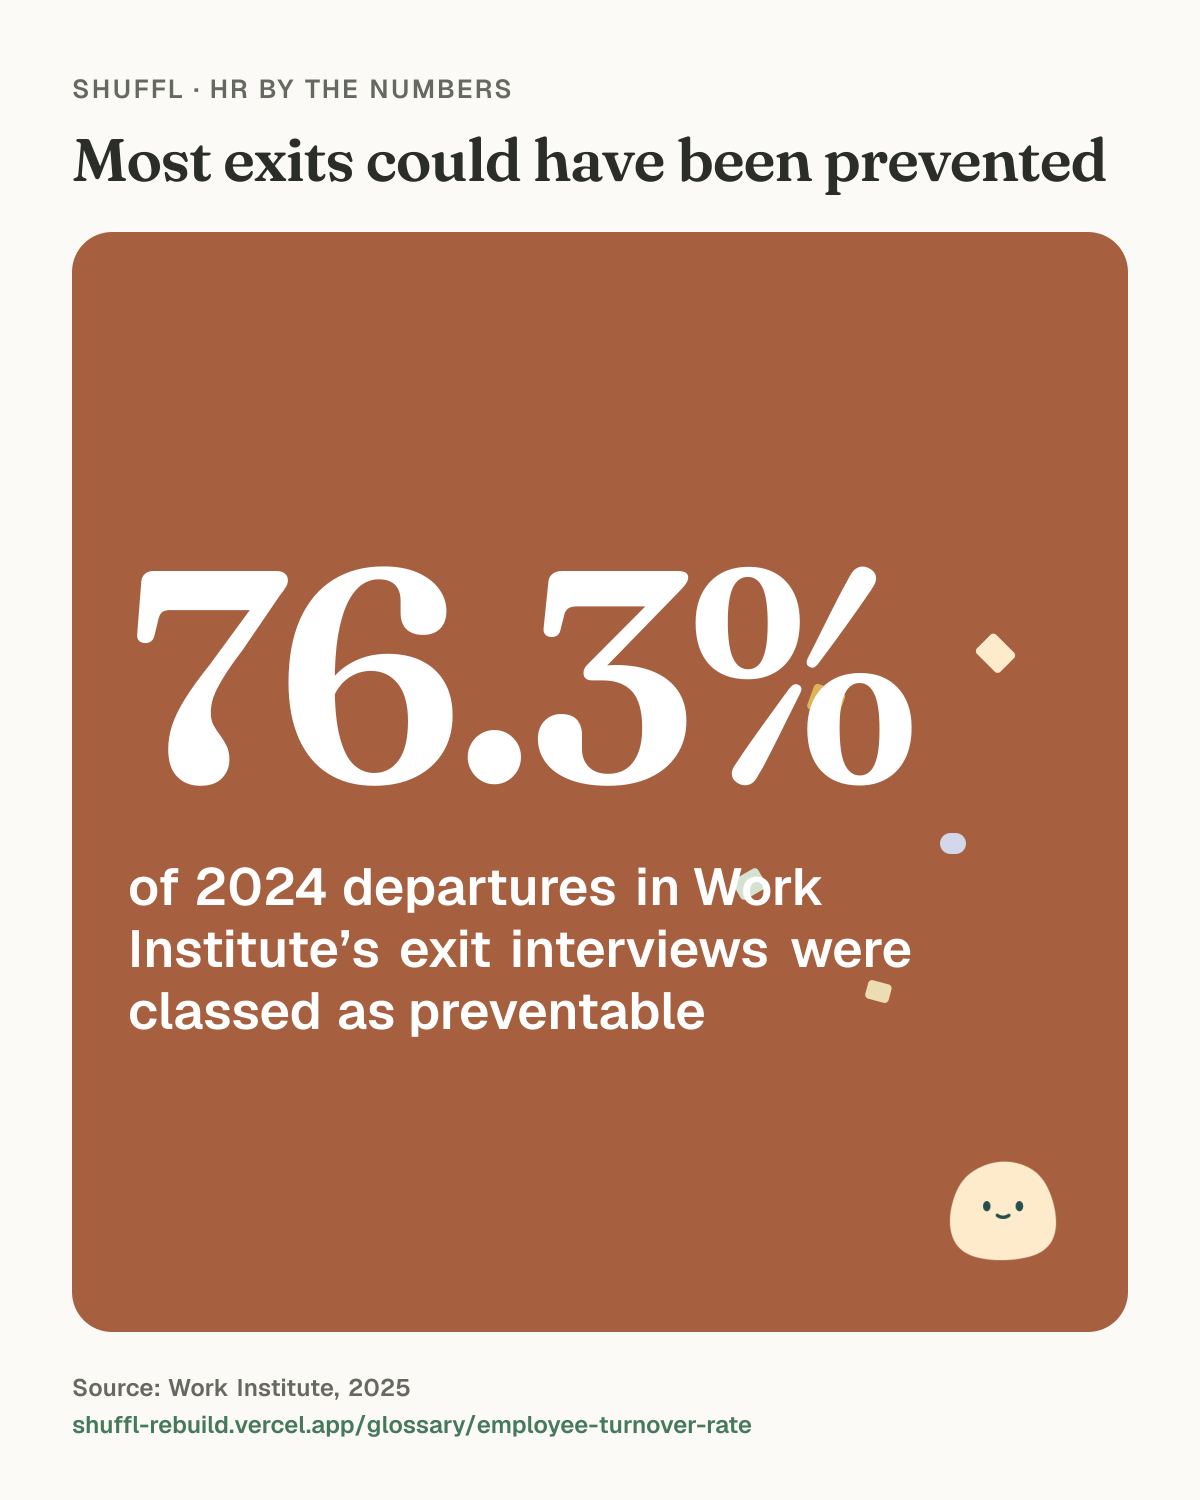
Exit interviews fill in the reasons. Work Institute, which runs third-party exit interviews for more than 175 employers, classed 76.3% of the 2024 departures it studied as preventable.3 Career development was the most common reason, at 18.9% of exits. Management behavior accounted for 9.7%, which the report calls a six-year high.3
The report puts the cost of replacing an employee at a conservative 33% of base pay, or at least $16,500 for someone earning $50,000.3
Shuffl · HR by the numbers
Most exits could have been prevented

Most exits could have been prevented: 76.3% of 2024 departures in Work Institute’s exit interviews were classed as preventable. Source: Work Institute, 2025.
An example
A 140-person logistics company had 31 separations last year on an average headcount of 138, a turnover rate of 22.5%. Nine were involuntary. The other 22 were resignations, which puts voluntary turnover at 16%.
Split by team, 14 of the 22 resignations came from the warehouse, which employs 48 of the 138 people. Voluntary turnover there was 29%, against 9% in the rest of the company. Exit interviews in the warehouse kept mentioning shift changes posted with a day’s notice. That gives the operations manager one specific thing to fix, and HR a number to watch next quarter.
How to lower turnover
Start with the split, then act on the teams where the numbers stand out.
- Report voluntary and involuntary turnover separately, and break both down by team and manager.
- Track first-year turnover on its own. Early leavers usually point to hiring or onboarding.
- Hold stay interviews with people you can’t afford to lose, before they start looking.
- Check pay against the market for the roles with the highest quit rates.
- Share exit interview themes each quarter with the managers who can act on them.
Common questions
- What is the difference between turnover and attrition?
- Turnover counts everyone who leaves. Attrition is usually narrower: people who leave and aren’t replaced, like a retirement or a role that’s cut. Some companies use the two words interchangeably, so check which definition a benchmark uses.
- How do you calculate annual turnover?
- Use the same formula with the monthly figures, then add up the 12 monthly rates. Or divide the year’s total separations by the average headcount for the year.
Sources
Read on . Numbers change as new studies come out, so check the source before you quote it.
- U.S. Bureau of Labor Statistics, Job Openings and Labor Turnover Survey technical note, September 1, 2026. Definitions of quits, layoffs and discharges, and other separations; sample design of about 21,000 establishments.
- U.S. Bureau of Labor Statistics, Job Openings and Labor Turnover Survey: annual average rates by industry (tables 20, 22 and 24), 2026 (2025 annual averages). Annual average monthly rates, not seasonally adjusted: the sum of 12 monthly separations as a percent of the sum of 12 monthly employment levels. Stratified random sample of about 21,000 nonfarm business and government establishments.
- Work Institute, 2025 Retention Report: Employee Retention Truths in Today’s Workplace, 2025. Based on 123,297 exit interviews conducted by Work Institute from 2019 to 2024 with more than 175 companies; 14,215 interviews cover 2024 reasons for leaving. Over 90% collected after the employee left, by Work Institute as a third party.