
HR glossary
Attrition rate
Attrition rate is the percentage of employees who leave and are not replaced, which shrinks the workforce over time.
Attrition is the slow shrink of a workforce as people leave and their jobs go unfilled. Retirements, resignations for roles you decide not to backfill, and positions cut through a hiring freeze all count.
Companies sometimes use attrition on purpose. Cutting costs through attrition means letting headcount fall as people leave, instead of laying anyone off.
Be careful with the word. In many HR teams and dashboards, attrition simply means turnover. Before you compare your rate to anyone else’s, confirm you are both counting the same people.
How to calculate attrition rate
Attrition rate = (departures not replaced ÷ average headcount) × 100
- Departures not replaced: people who left and whose roles were not refilled
- Average headcount: (headcount at start + headcount at end) ÷ 2
Example: 8 people left this year and none of their roles were refilled. Average headcount was 160. 8 ÷ 160 × 100 = 5% attrition.
What the research says
Public data can’t show attrition in the narrow sense, because it doesn’t know which jobs were refilled. The closest government measure is the JOLTS category of “other separations,” which covers retirements, transfers to other locations, disability and deaths.1 In July 2026 there were 350,000 other separations in the U.S., compared with 3.1 million quits.2
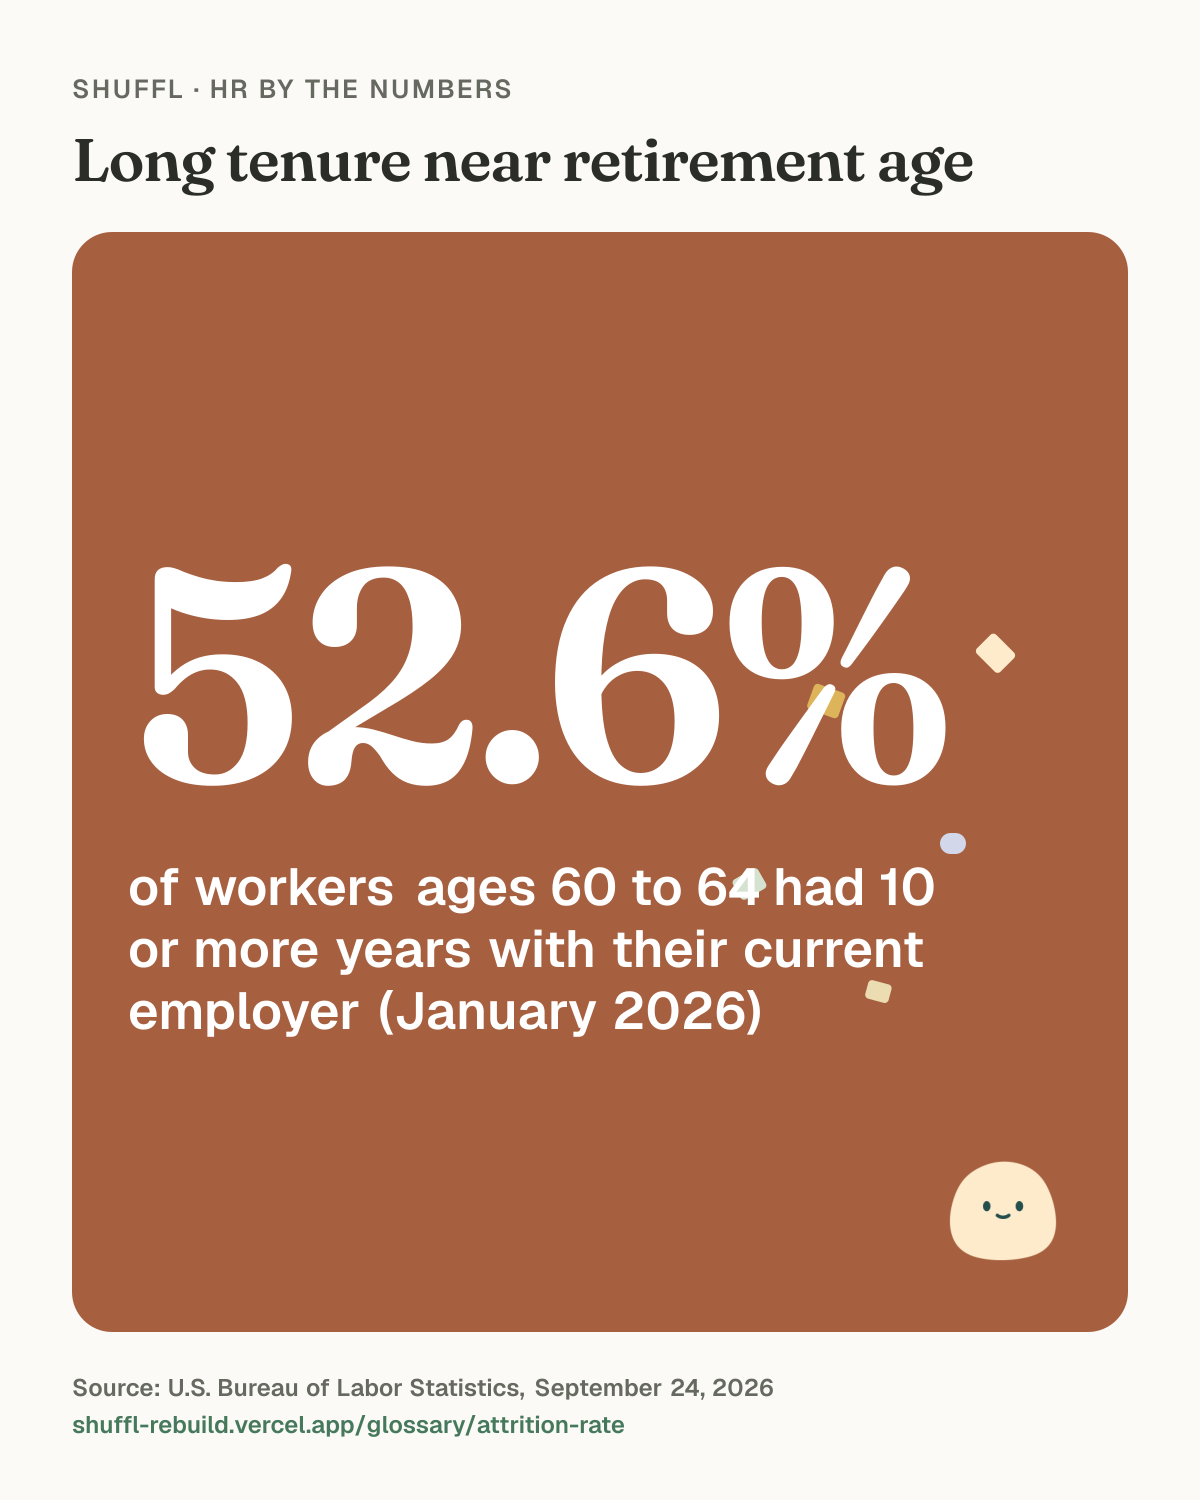
Retirement is the part of attrition you can see coming. BLS tenure data from January 2026 shows that 52.6% of workers ages 60 to 64 had been with their current employer for at least 10 years.3 When those people leave, a decade of knowledge about customers, systems and workarounds can leave with them unless someone has been learning it alongside them.
Shuffl · HR by the numbers
Long tenure near retirement age

Long tenure near retirement age: 52.6% of workers ages 60 to 64 had 10 or more years with their current employer (January 2026). Source: U.S. Bureau of Labor Statistics, September 24, 2026.
An example
A 300-person regional insurer wants to reduce headcount by about 20 over 18 months without layoffs. HR lists every role and marks it “backfill” or “absorb.” Claims handlers are backfilled because claim volume hasn’t dropped. Some data-entry roles and one layer of team leads are marked absorb.
After 12 months, 14 people in absorb roles have left and weren’t replaced. Headcount went from 300 to 286, an average of 293, so attrition for the year is 14 ÷ 293 = 4.8%. At that pace the insurer reaches about 21 by month 18. The team leads who remain now manage larger groups, so HR checks their workload at every quarterly review.
How to plan for attrition
Reducing headcount through attrition is slow and uneven. You don’t choose who leaves, so a team can lose its strongest person while the role you most wanted to cut stays filled. A plan decided in advance keeps the choices deliberate.
Shuffl · HR by the numbers
Planning for attrition
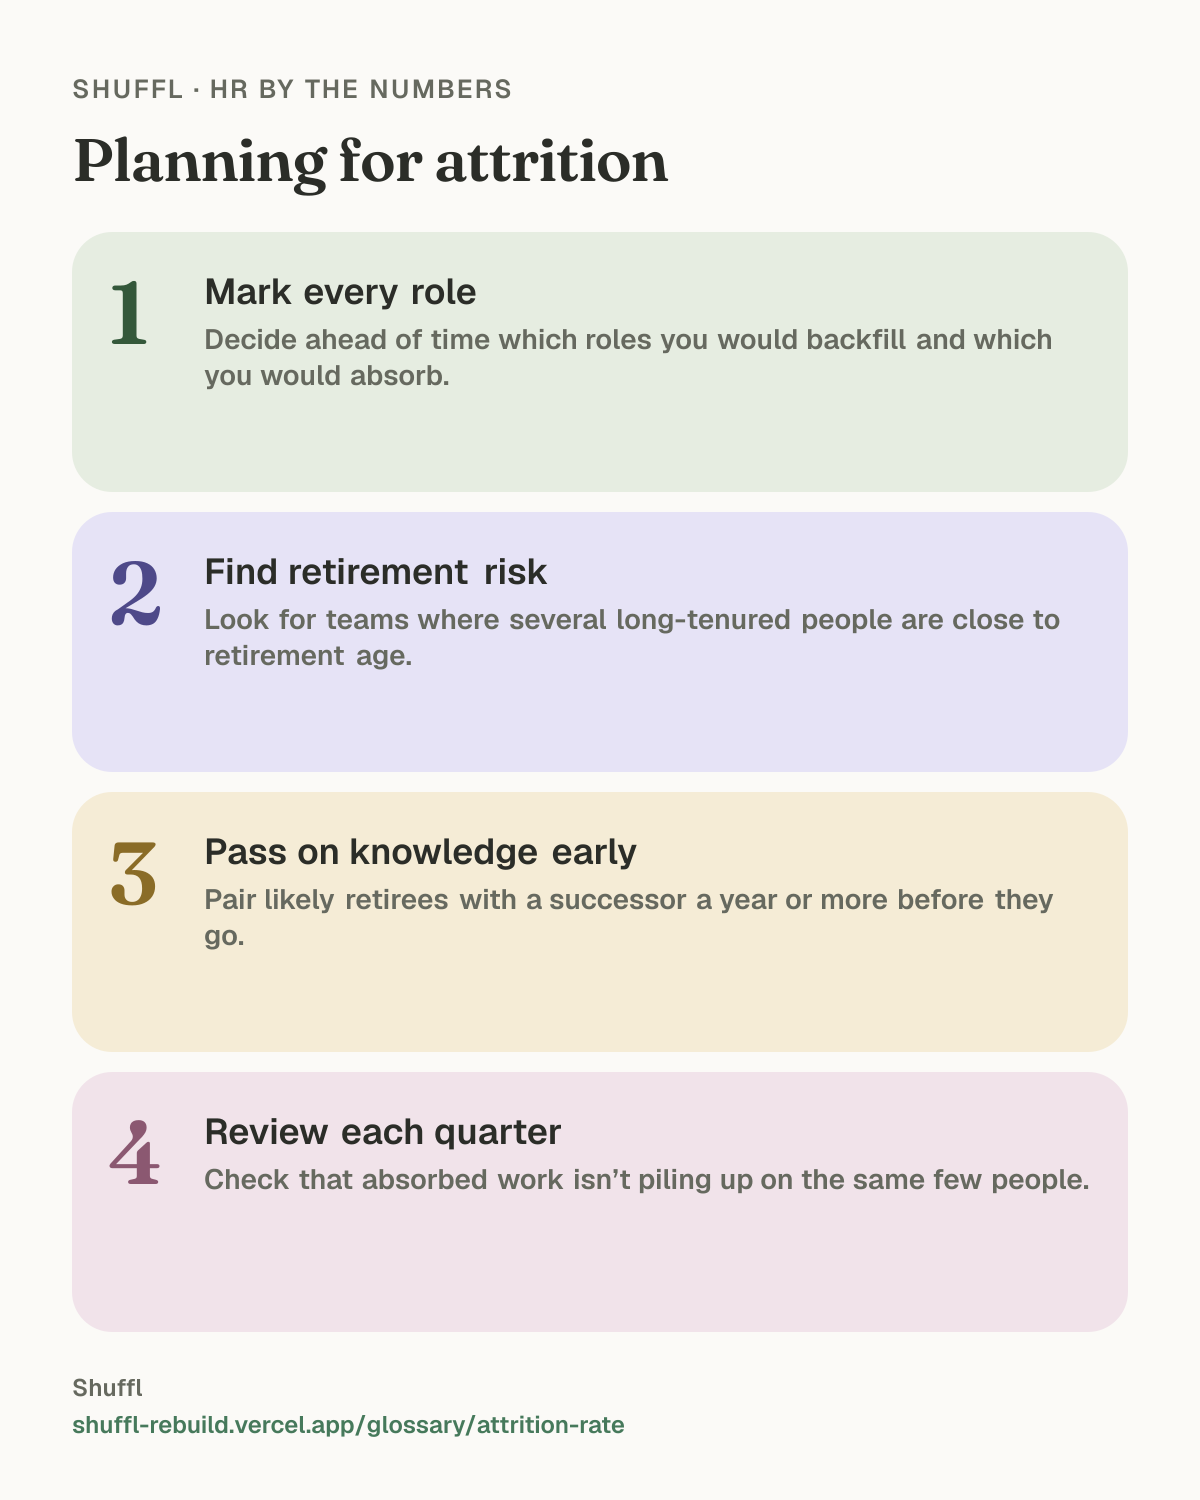
Planning for attrition. 1. Mark every role: Decide ahead of time which roles you would backfill and which you would absorb. 2. Find retirement risk: Look for teams where several long-tenured people are close to retirement age. 3. Pass on knowledge early: Pair likely retirees with a successor a year or more before they go. 4. Review each quarter: Check that absorbed work isn’t piling up on the same few people.
Common questions
- Is high attrition always bad?
- Not always. Attrition that follows a planned reduction, or natural retirements, can be healthy. Losing strong performers you meant to keep is a problem either way.
- What does “reduction through attrition” mean?
- It means reducing headcount by not replacing people who leave, rather than laying people off.
Sources
Read on . Numbers change as new studies come out, so check the source before you quote it.
- U.S. Bureau of Labor Statistics, Job Openings and Labor Turnover Survey technical note, September 1, 2026. Definitions of quits, layoffs and discharges, and other separations; sample design of about 21,000 establishments.
- U.S. Bureau of Labor Statistics, Job Openings and Labor Turnover Summary, July 2026, September 1, 2026. Monthly JOLTS release, seasonally adjusted, from a sample of about 21,000 nonfarm establishments.
- U.S. Bureau of Labor Statistics, Employee Tenure in 2026, September 24, 2026. January 2026 supplement to the Current Population Survey, a monthly sample survey of about 60,000 eligible households. Covers wage and salary workers.