
HR glossary
Absenteeism rate
Absenteeism rate is the share of scheduled work time lost to unplanned absences.
Absenteeism means unplanned absence: sick days, no-shows and last-minute days off. Approved vacation and scheduled leave don’t count.
Some absence is normal. People get sick. A rate that climbs, or one that runs much higher on one team, can point to burnout, poor management, or a health issue spreading through an office.
Track it by team and by month. Look at the pattern before you look at individuals.
How to calculate absenteeism rate
Absenteeism rate = (unplanned absence days ÷ total scheduled workdays) × 100
- Unplanned absence days: sick days, no-shows and unapproved days off
- Total scheduled workdays: employees × workdays in the period
Example: 50 employees each had 21 scheduled workdays in a month, 1,050 days in total. Together they had 25 unplanned absence days. 25 ÷ 1,050 × 100 = 2.4%.
What the research says
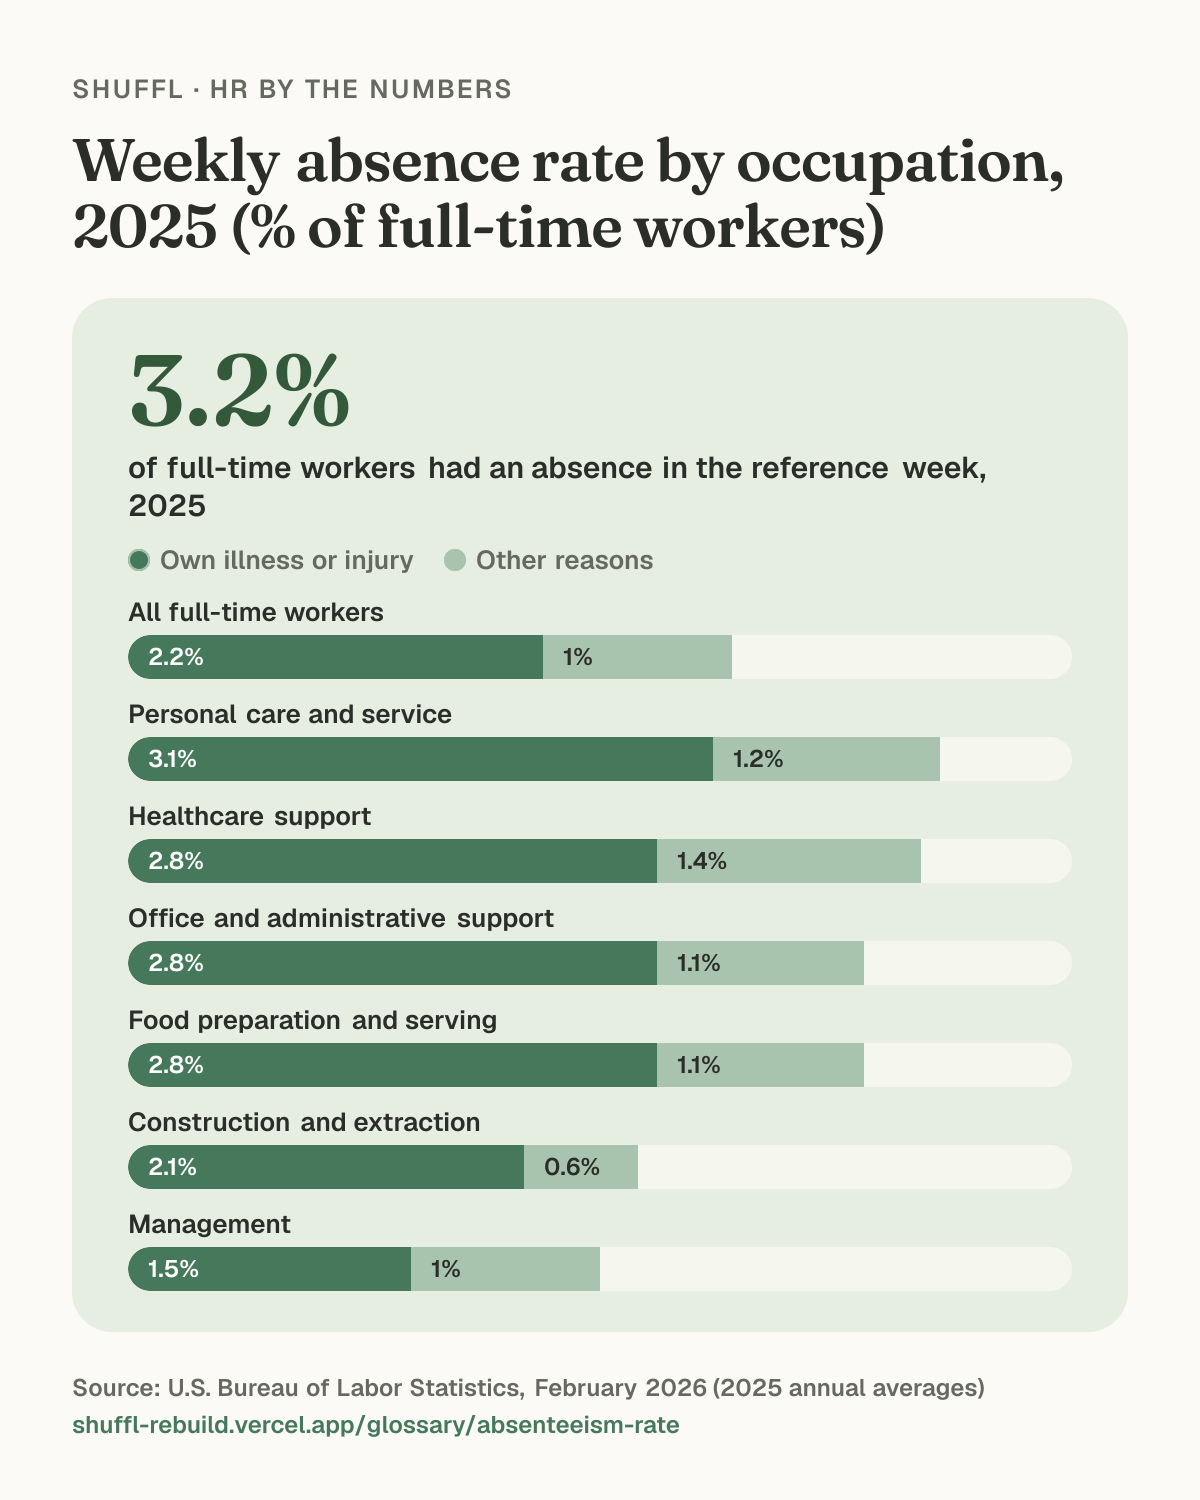
The Bureau of Labor Statistics measures absence through the Current Population Survey. In 2025, 3.2% of full-time wage and salary workers had an absence in the survey’s reference week, and for 2.2% the reason was their own illness, injury or medical problem.1 Vacation, personal days and holidays aren’t counted.
The BLS lost worktime rate is closer to the formula on this page, because it measures hours absent as a share of hours usually worked. It was 1.7% for all full-time workers in 2025 and 2.2% in the public sector.1
Type of work matters. Personal care and service occupations had a 4.3% absence rate, while management occupations had 2.5%.1
Shuffl · HR by the numbers
Weekly absence rate by occupation, 2025 (% of full-time workers)
Weekly absence rate by occupation, 2025 (% of full-time workers). 3.2% of full-time workers had an absence in the reference week, 2025. All full-time workers: 2.2% Own illness or injury, 1% Other reasons. Personal care and service: 3.1% Own illness or injury, 1.2% Other reasons. Healthcare support: 2.8% Own illness or injury, 1.4% Other reasons. Office and administrative support: 2.8% Own illness or injury, 1.1% Other reasons. Food preparation and serving: 2.8% Own illness or injury, 1.1% Other reasons. Construction and extraction: 2.1% Own illness or injury, 0.6% Other reasons. Management: 1.5% Own illness or injury, 1% Other reasons. Source: U.S. Bureau of Labor Statistics, February 2026 (2025 annual averages).
An example
A 90-person food manufacturer runs two shifts. In March, the day shift of 50 people had 1,050 scheduled days and 22 unplanned absence days, a rate of 2.1%. The night shift of 40 had 840 scheduled days and 38 absence days, or 4.5%.
Eighteen of the night shift’s absences fell on a Monday, and most came from one production line. In one-to-ones, people on that line said weekend overtime was being handed out at the end of the Friday shift. Operations moved overtime to a rota posted a week ahead. By June the night-shift rate was 3.1%.
How to reduce absenteeism
Look for patterns before you look at individuals. A spike on Mondays on one team says something different from a winter flu season across the whole company.
- Break the rate down by team, shift, day of week and month.
- Have a short return-to-work conversation after each absence, and keep it about support.
- Check workload, overtime and scheduling on teams with high rates.
- Make sure your attendance policy doesn’t count protected leave against people. In the U.S., the FMLA gives eligible employees of covered employers unpaid, job-protected leave for qualifying family and medical reasons,2 and many states and cities add their own paid sick leave rules.
Common questions
- What is a normal absenteeism rate?
- Figures around 1.5% to 3% of scheduled time are common for office roles. Physically demanding and shift-based jobs tend to run higher.
- What is the difference between absenteeism and presenteeism?
- Absenteeism is not being at work. Presenteeism is being at work while too ill or exhausted to do it well. Both cost productivity, and pushing hard on one can raise the other.
Sources
Read on . Numbers change as new studies come out, so check the source before you quote it.
- U.S. Bureau of Labor Statistics, Absences from work of employed full-time wage and salary workers by occupation and industry (CPS table 47), February 2026 (2025 annual averages). Current Population Survey, full-time wage and salary workers. Absence rate is the share of workers with an absence in the reference week for illness, child care, family obligations, civic duty or parental leave; vacation, personal days and holidays are excluded. 2025 figures are 11-month averages because October 2025 data were not collected.
- U.S. Department of Labor, Wage and Hour Division, Family and Medical Leave Act, Current page, read September 2026. Regulator overview of the federal FMLA.